Sales & Inventory Dashboard for Watches
PLATFORM
DESKTOP
SCOPE
UI, UX, BRANDING IDENTITY
PLATFORM
DESKTOP
SCOPE
UI, UX, BRANDING IDENTITY
PLATFORM
DESKTOP
SCOPE
UI, UX
TOOLS
SKETCH APP, ADOBE ILLUSTRATOR, INVISION
YEAR
2017
TOOLS
SKETCH APP, ILLUSTRATOR, INVISION
YEAR
2017
TOOLS
SKETCH APP, ADOBE ILLUSTRATOR, INVISION
YEAR
2017
Background
The Client is a company that buys and sells luxury watches. Before using the new dashboard, the client had been doing the inventory and listing manually.
Challenge
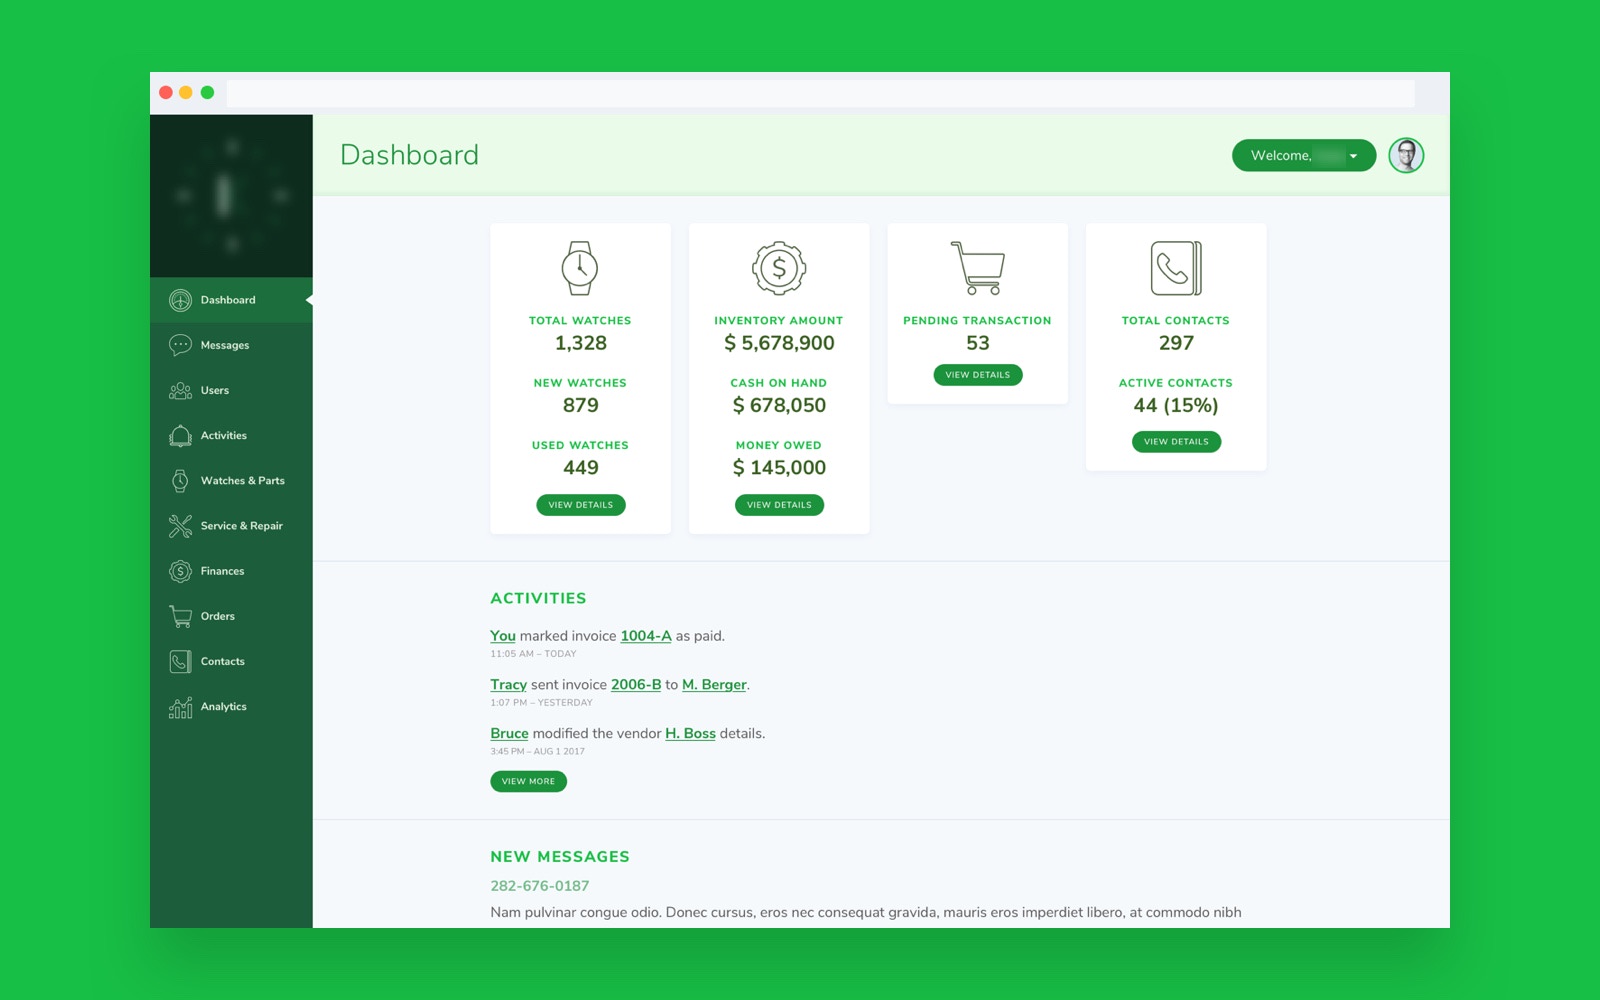
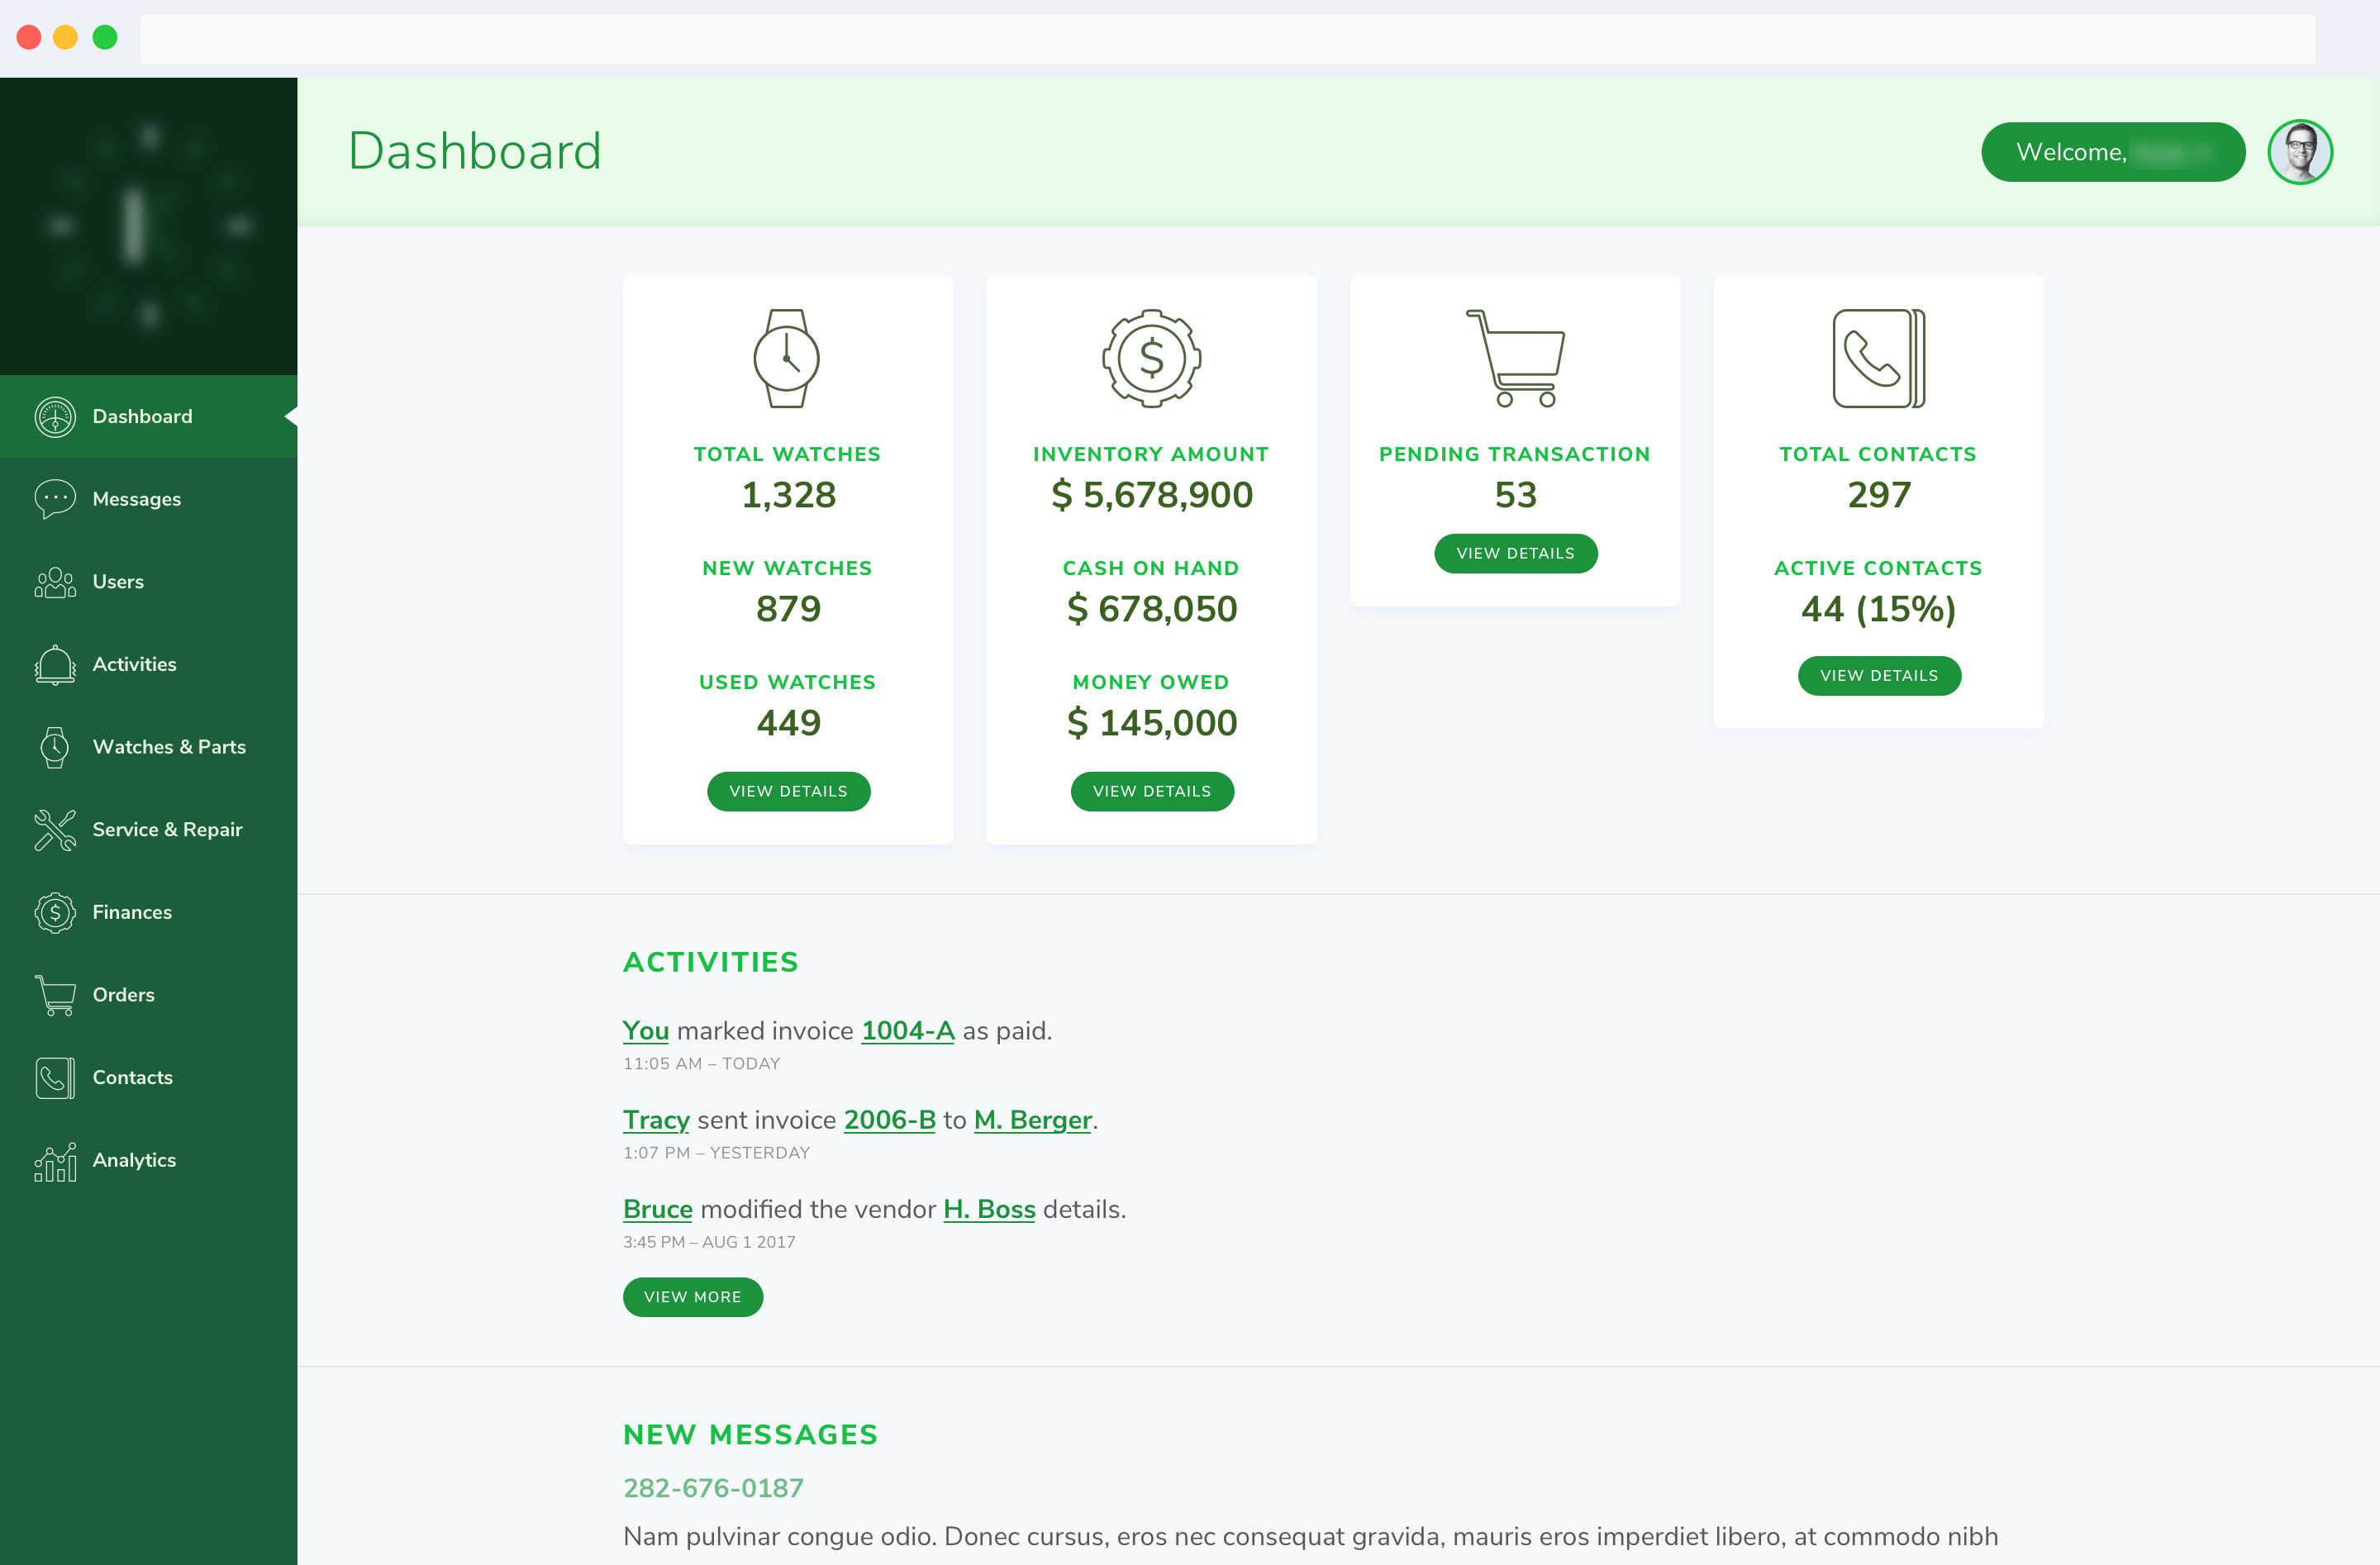
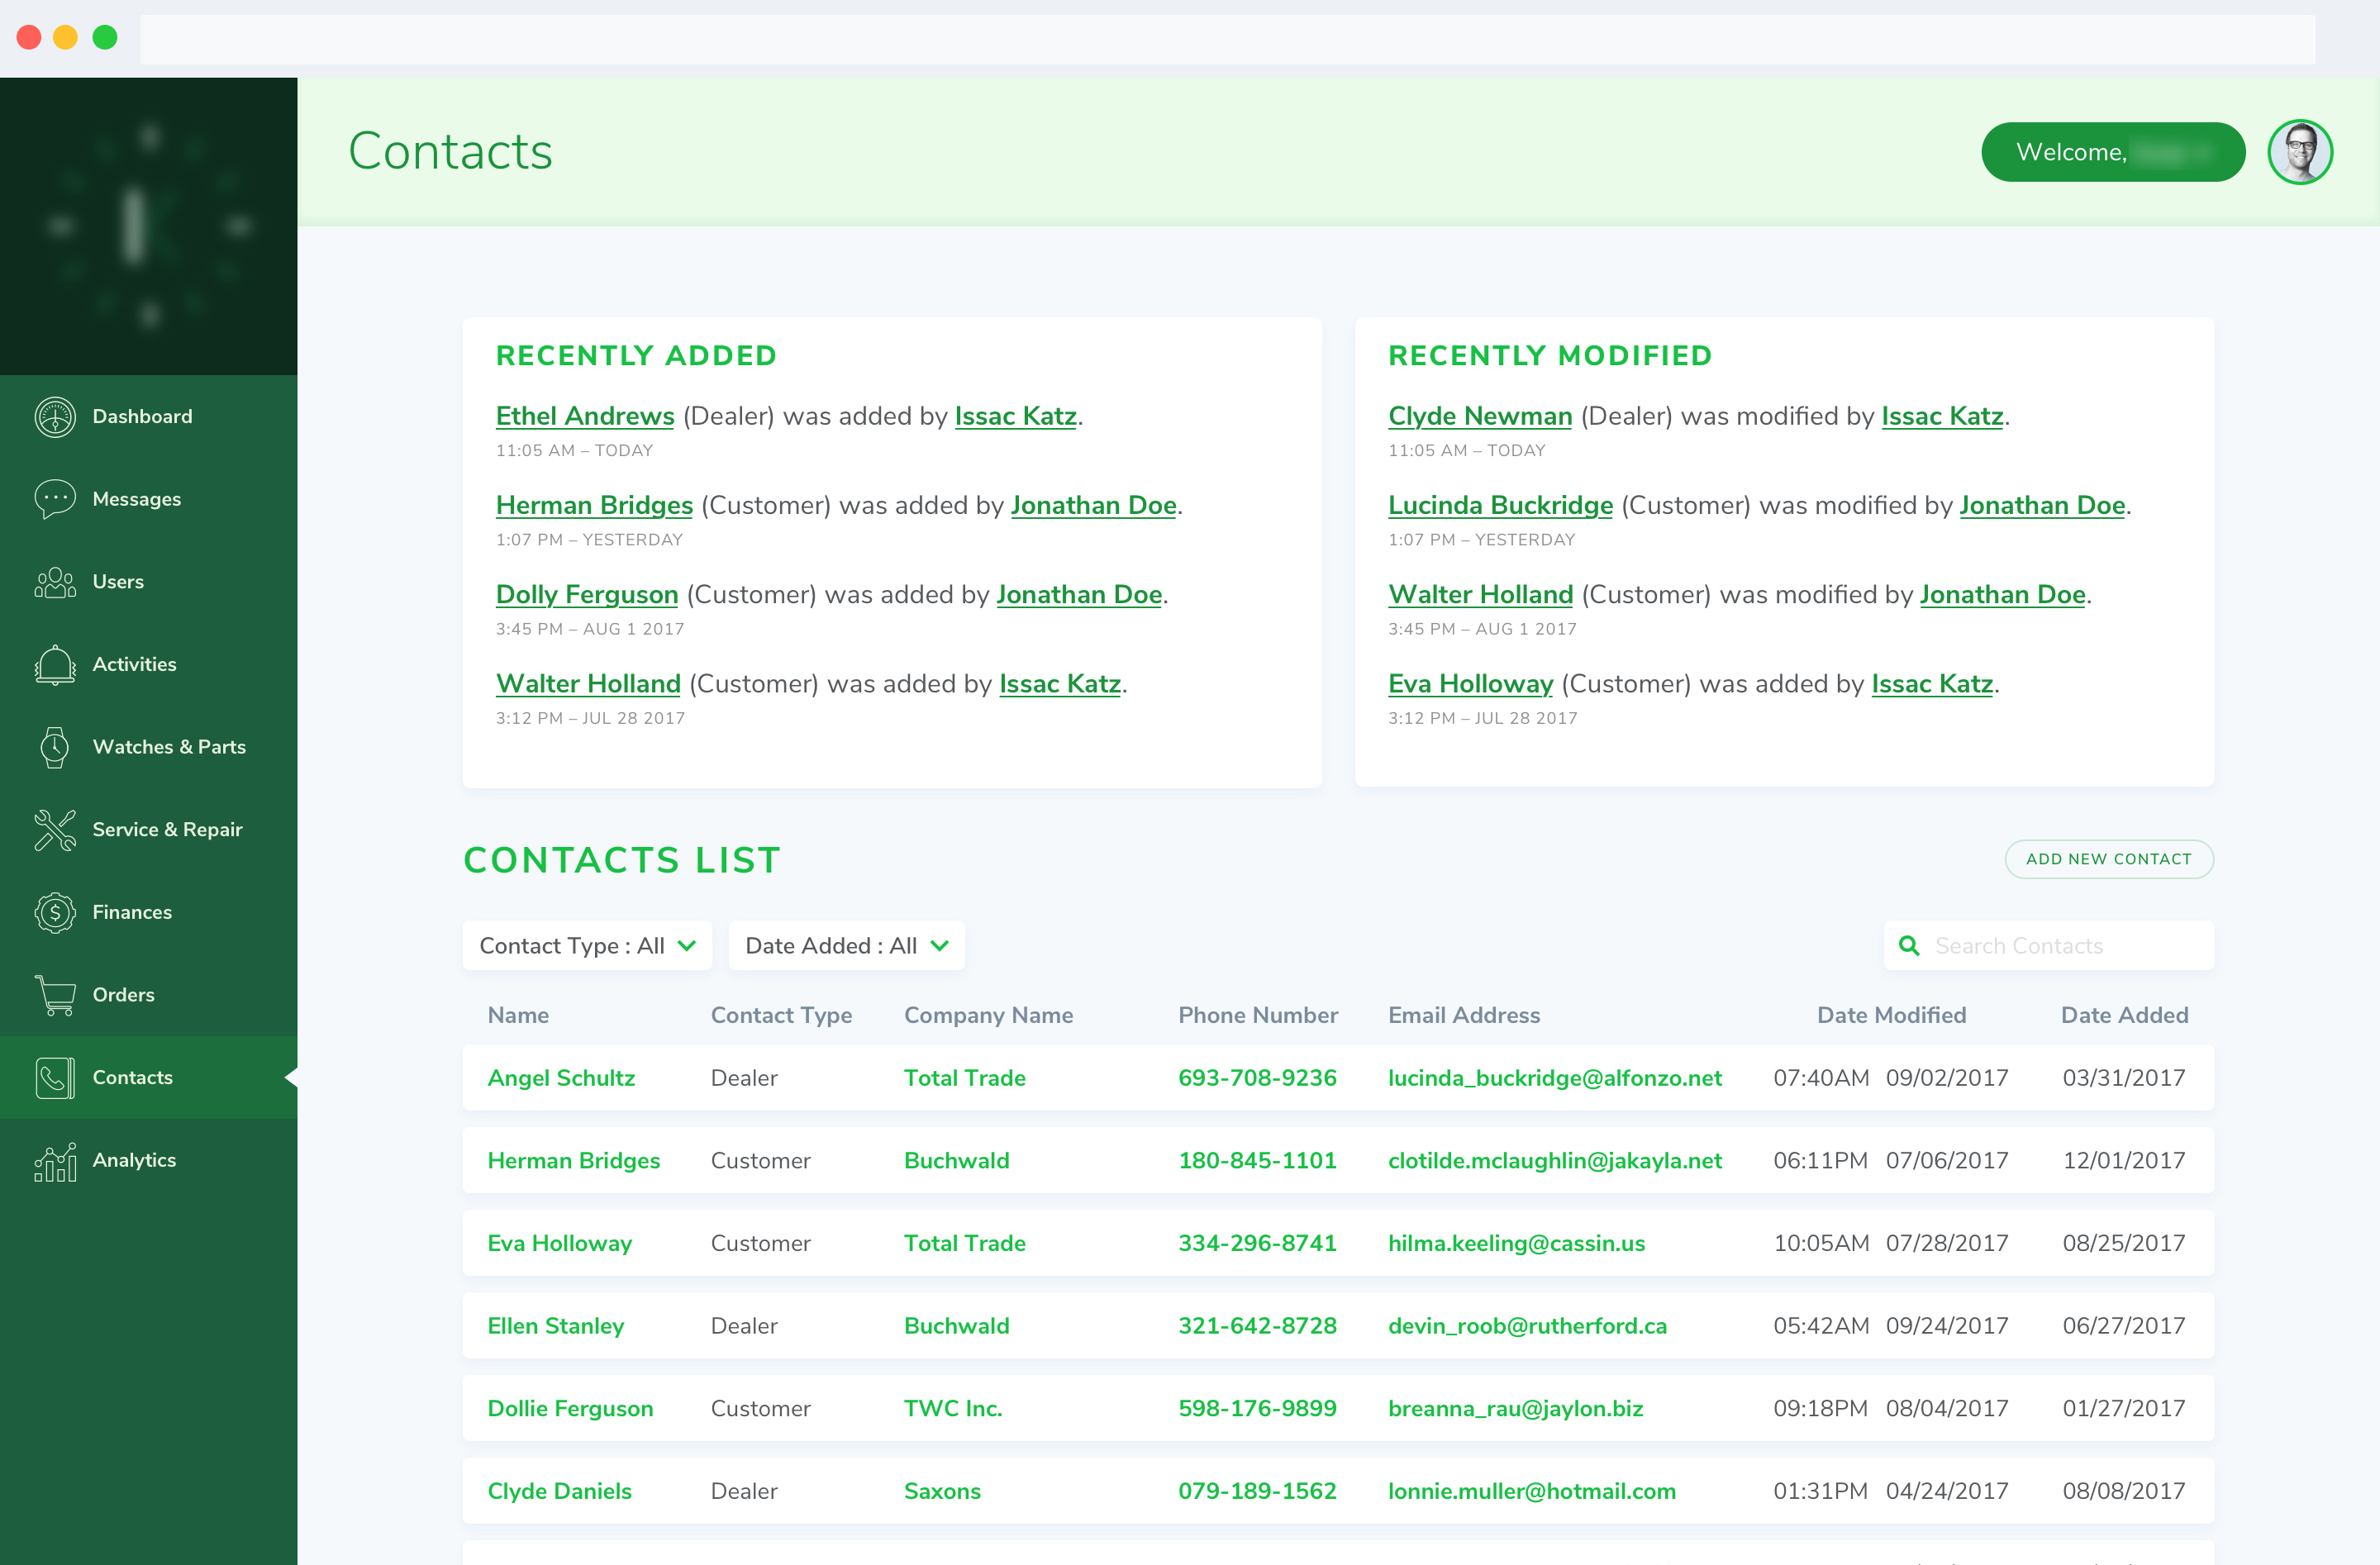
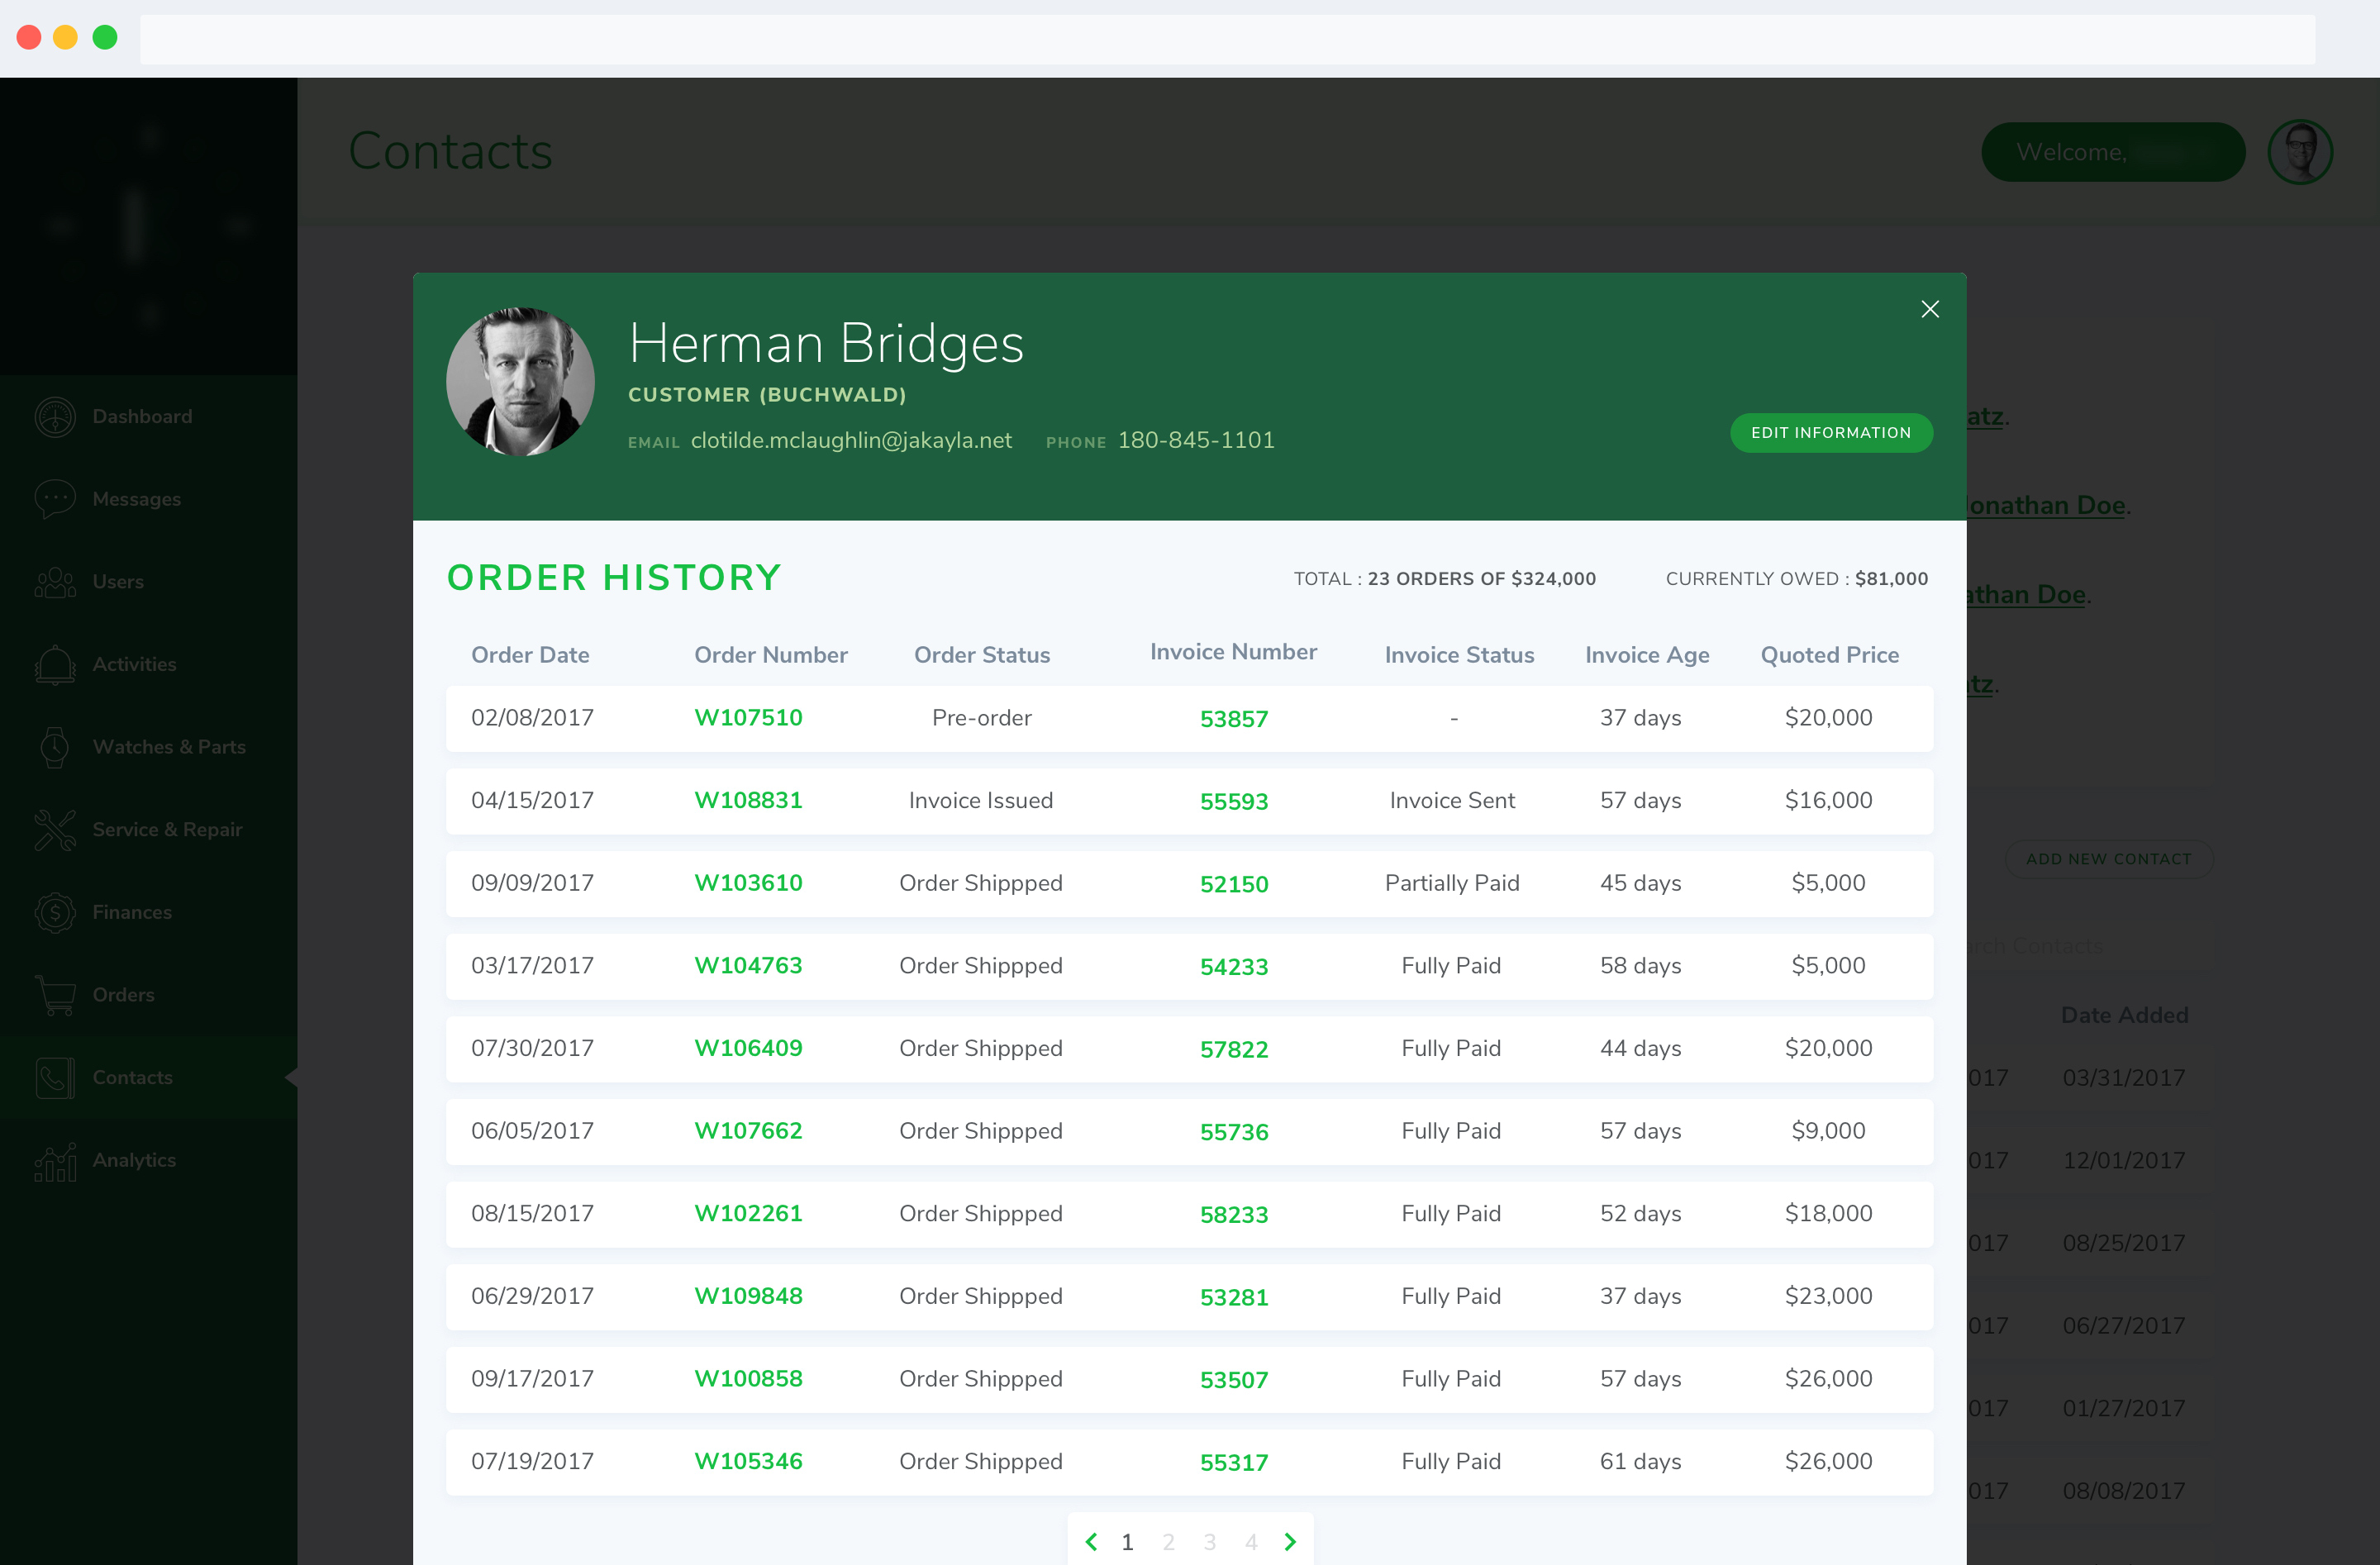
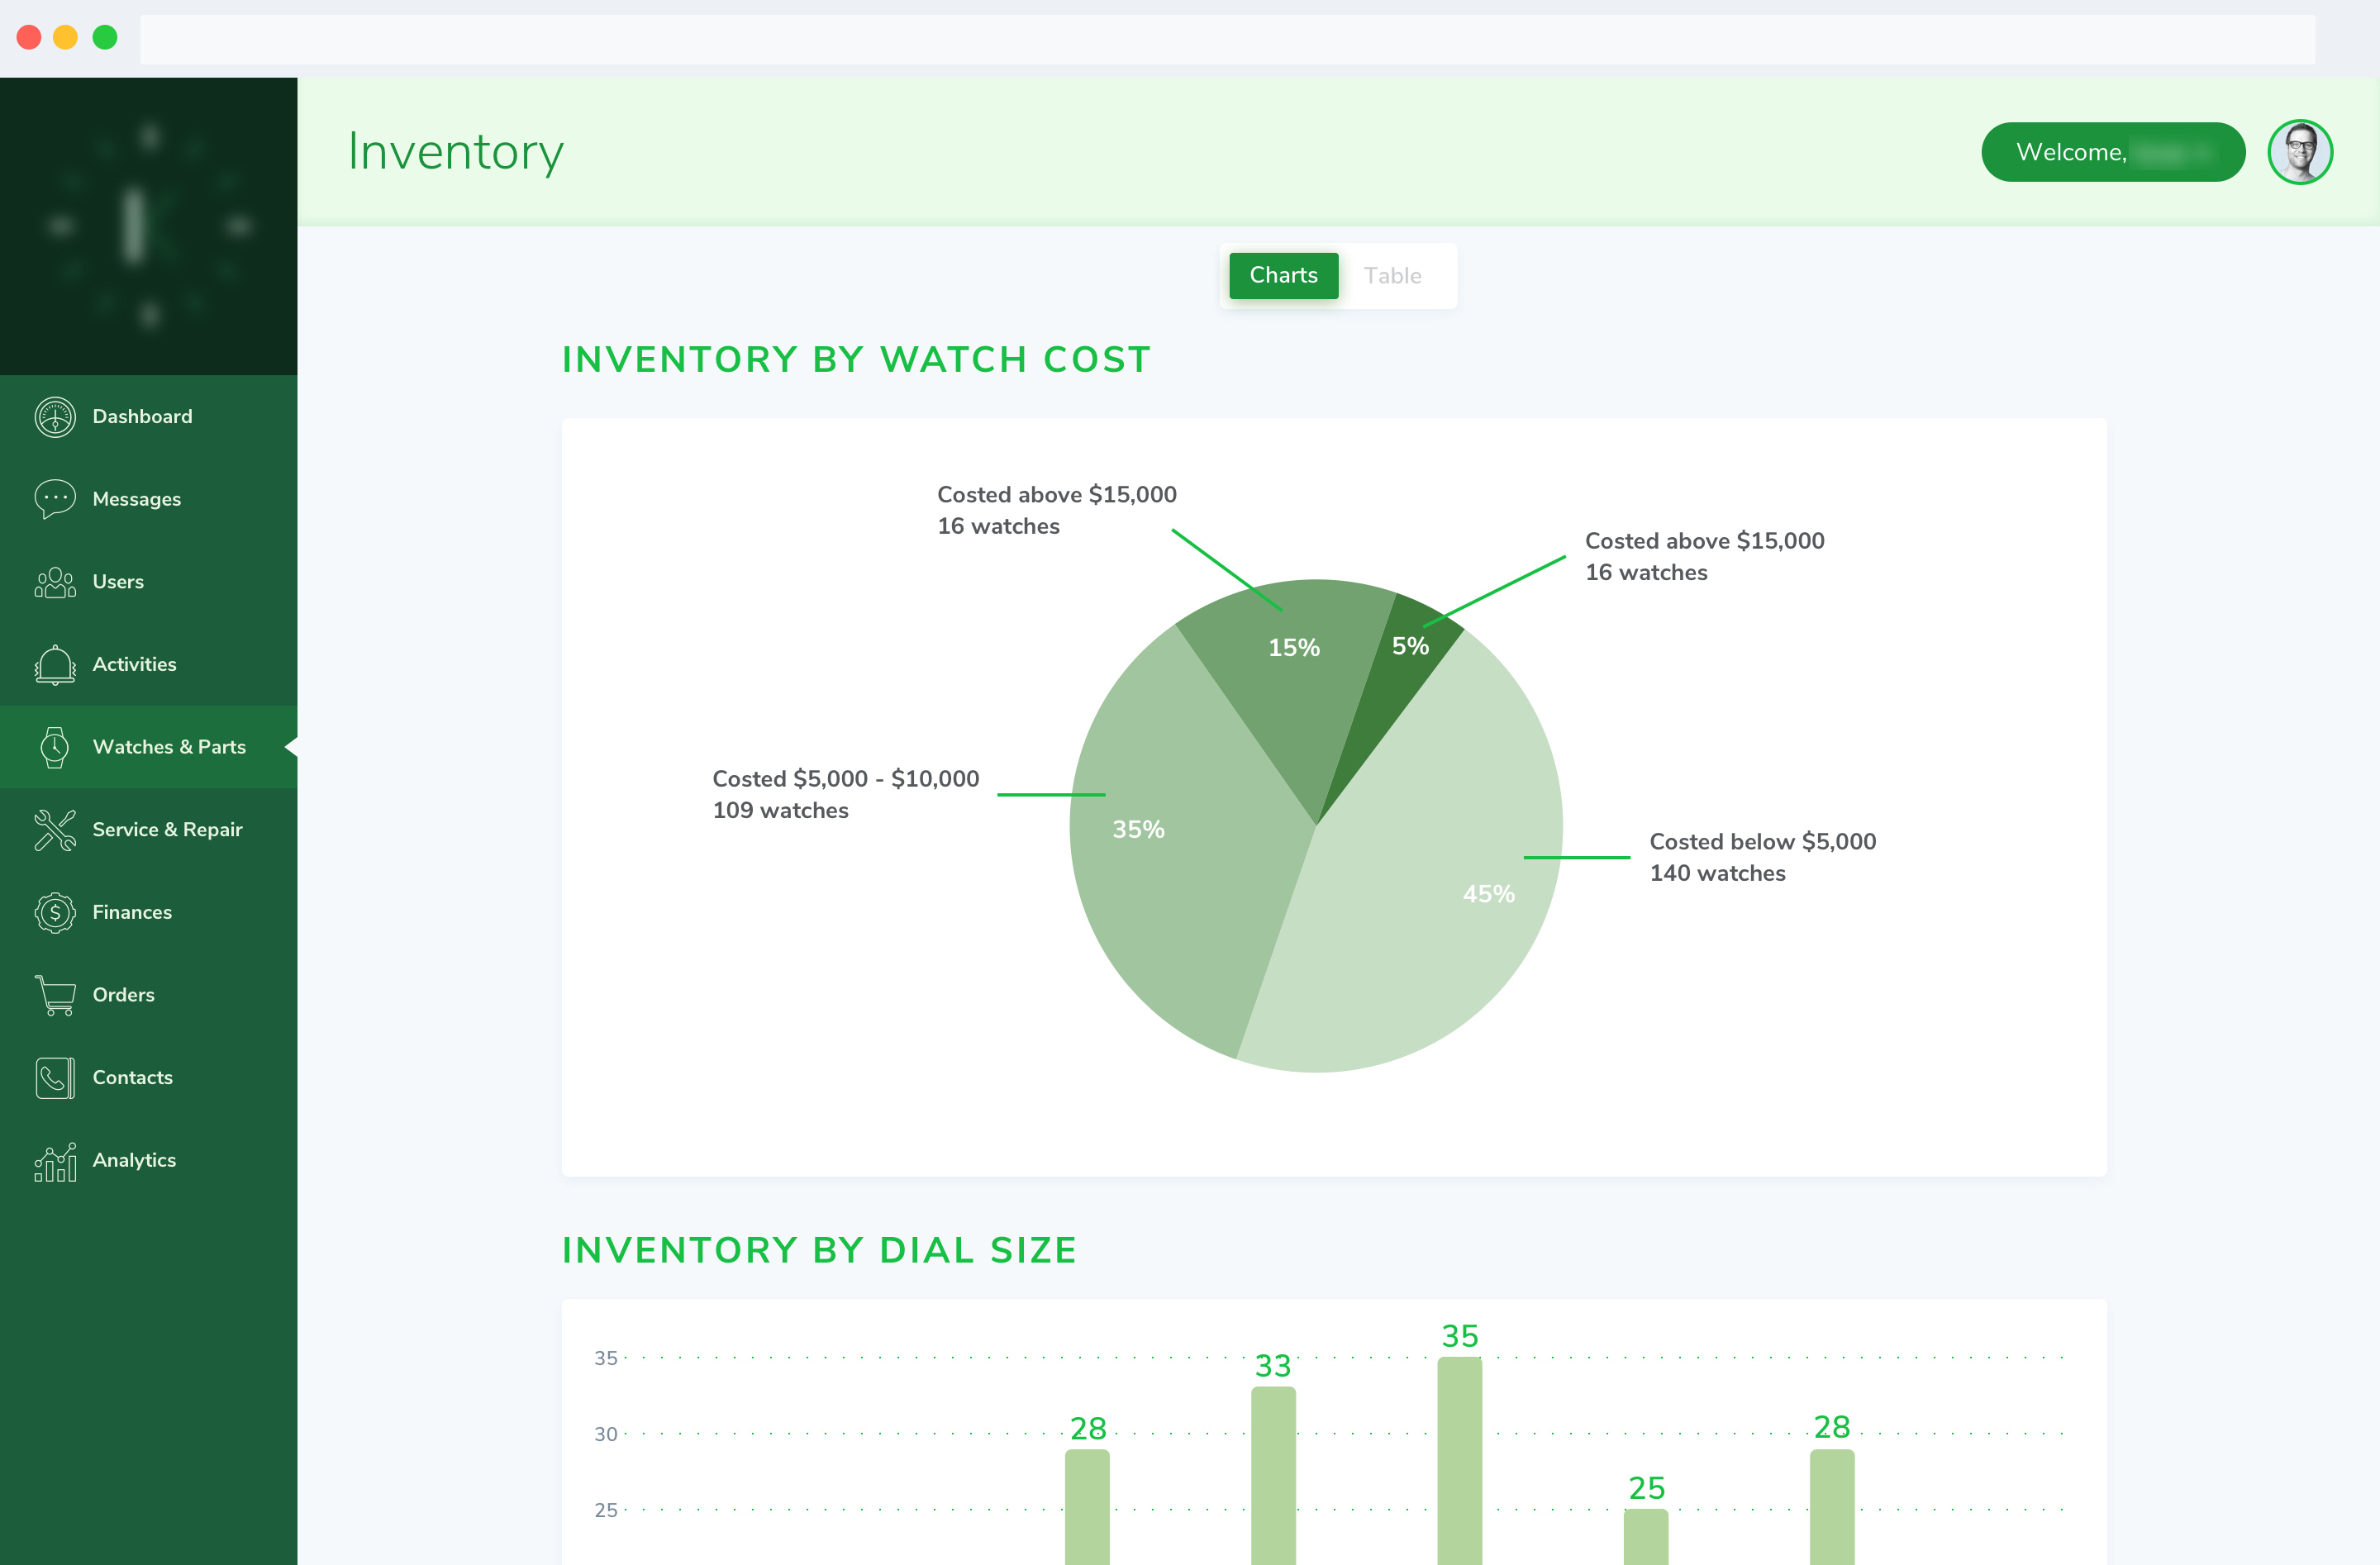
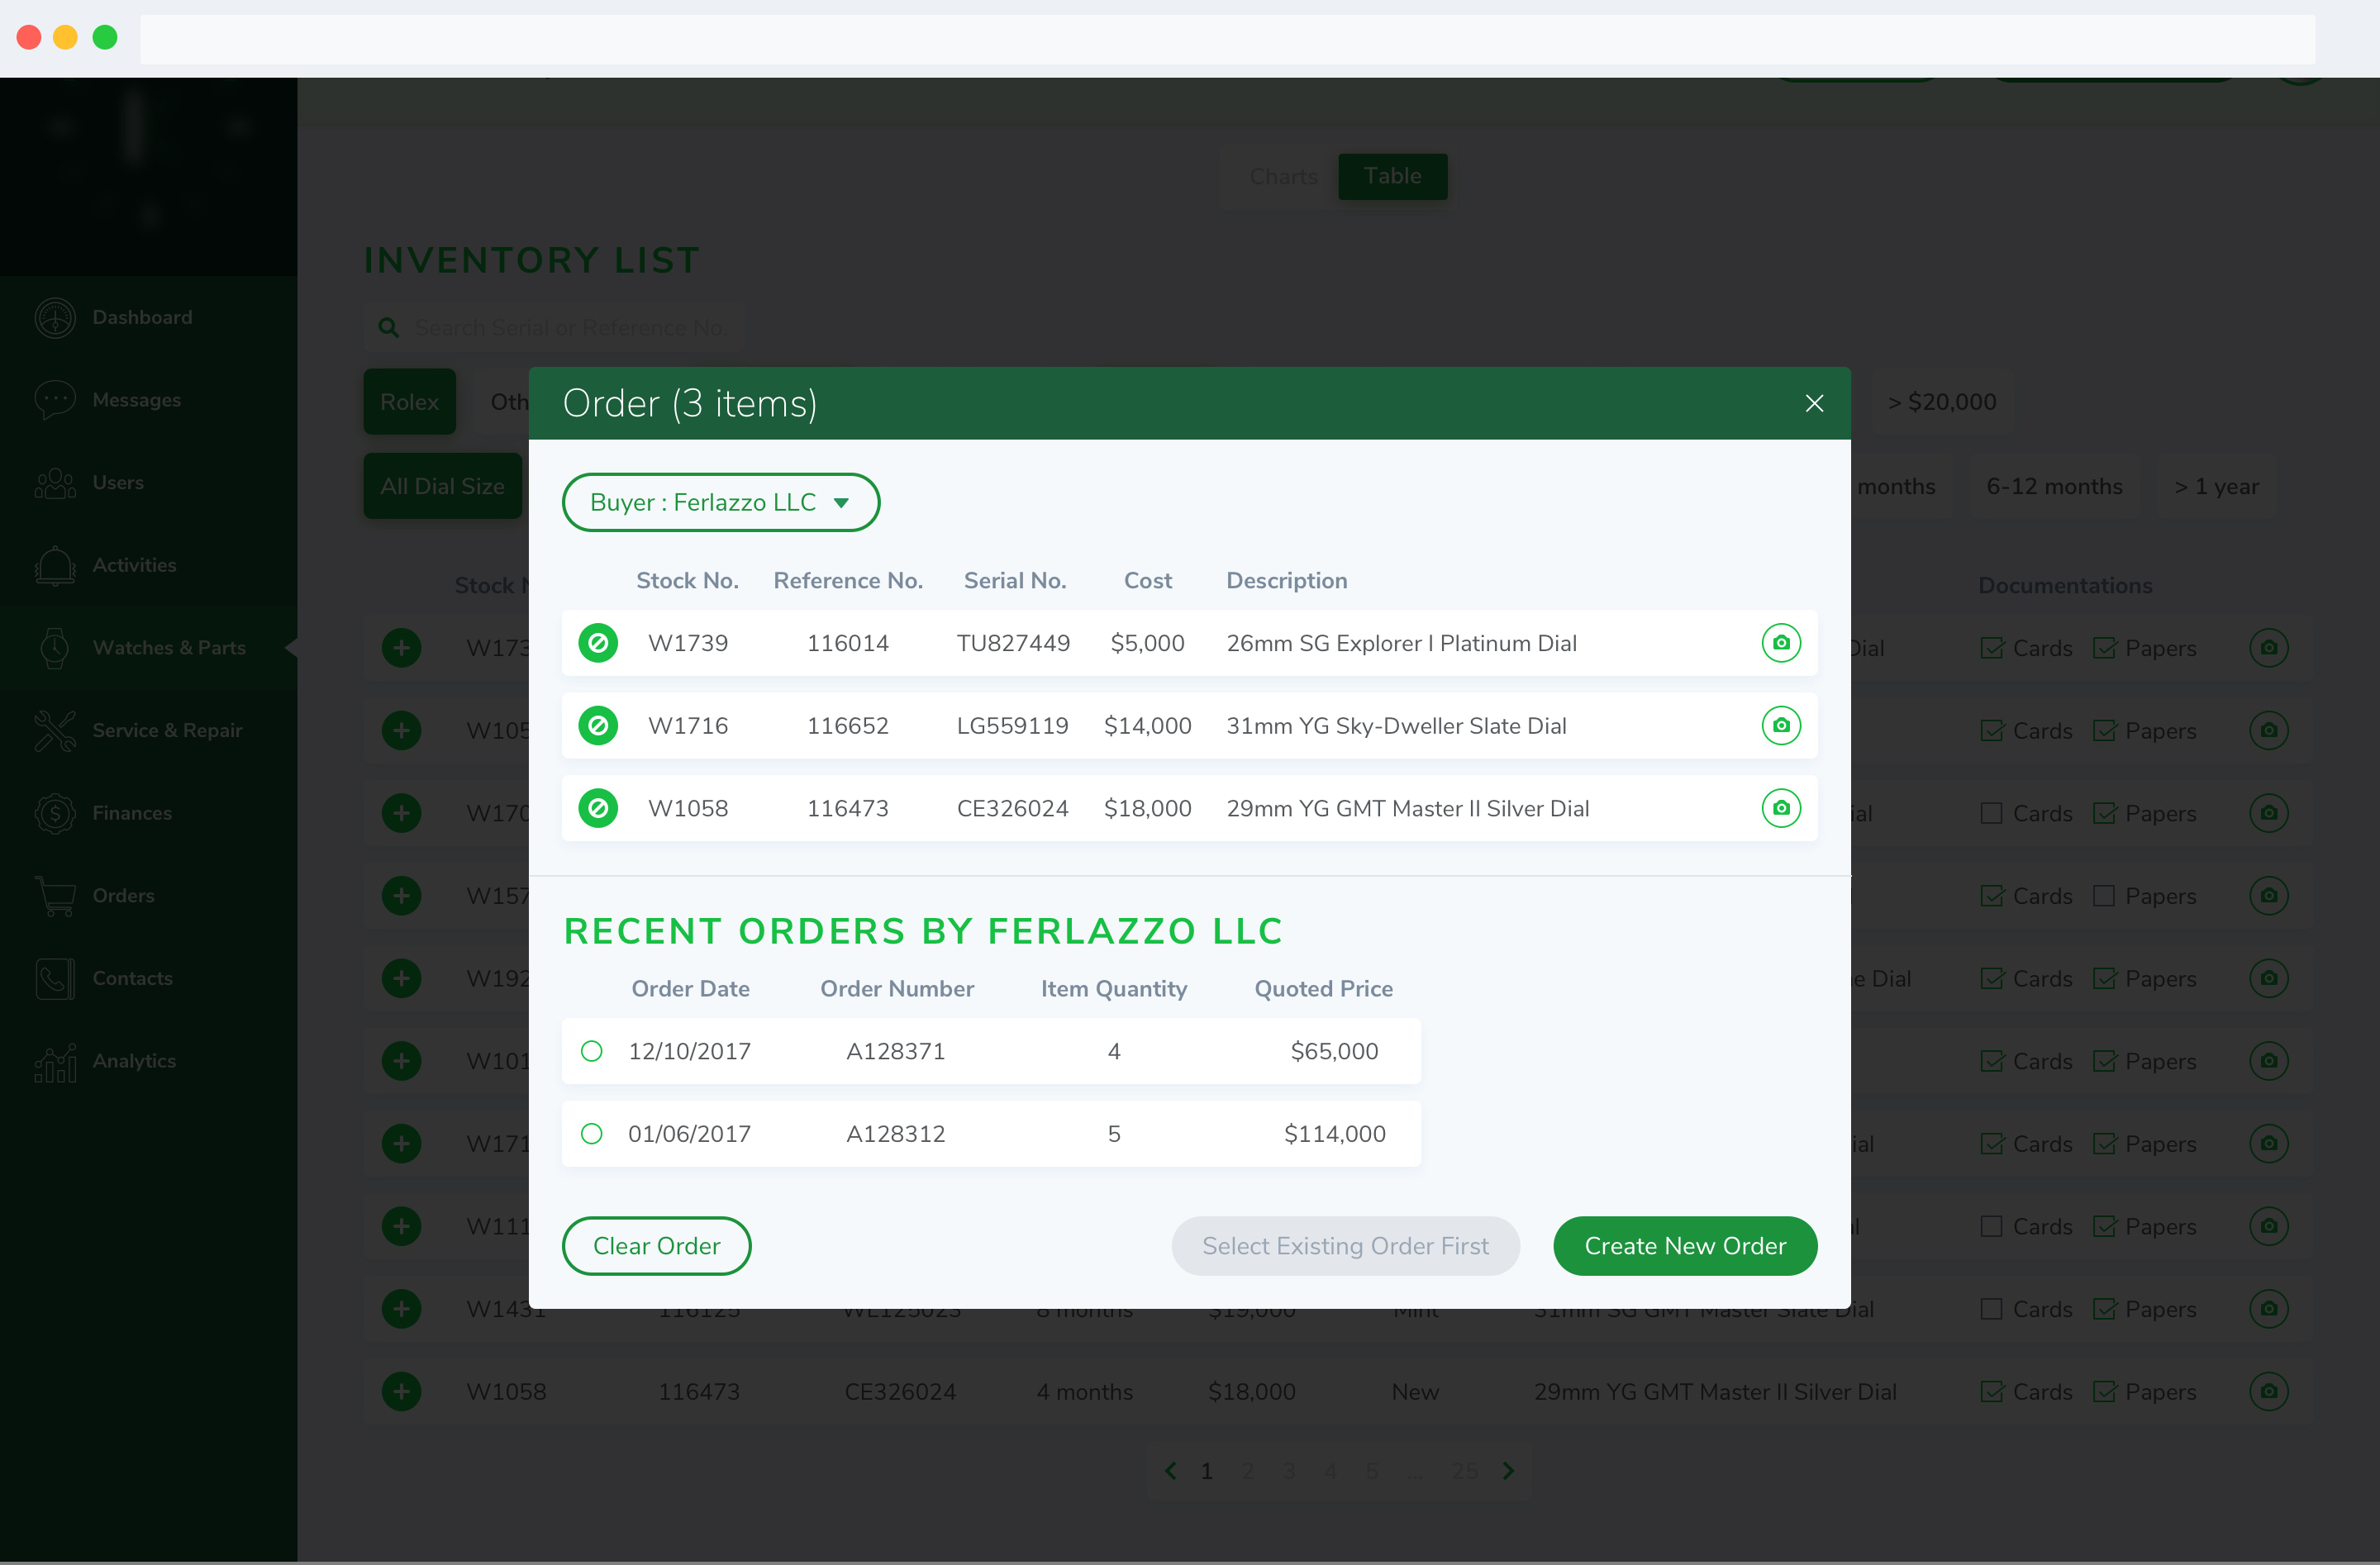
The dashboard must be able to catalog its watches and create orders and invoices as well as show the analytics regarding the inventory and sales. The analytics is important as it helps the user to quickly analyze the data that the company has regarding inventories, orders, invoices, and contacts. As a part of the project, the company also had the branding identity designed for them. In this project, I was the sole UI and UX designer.
Solution
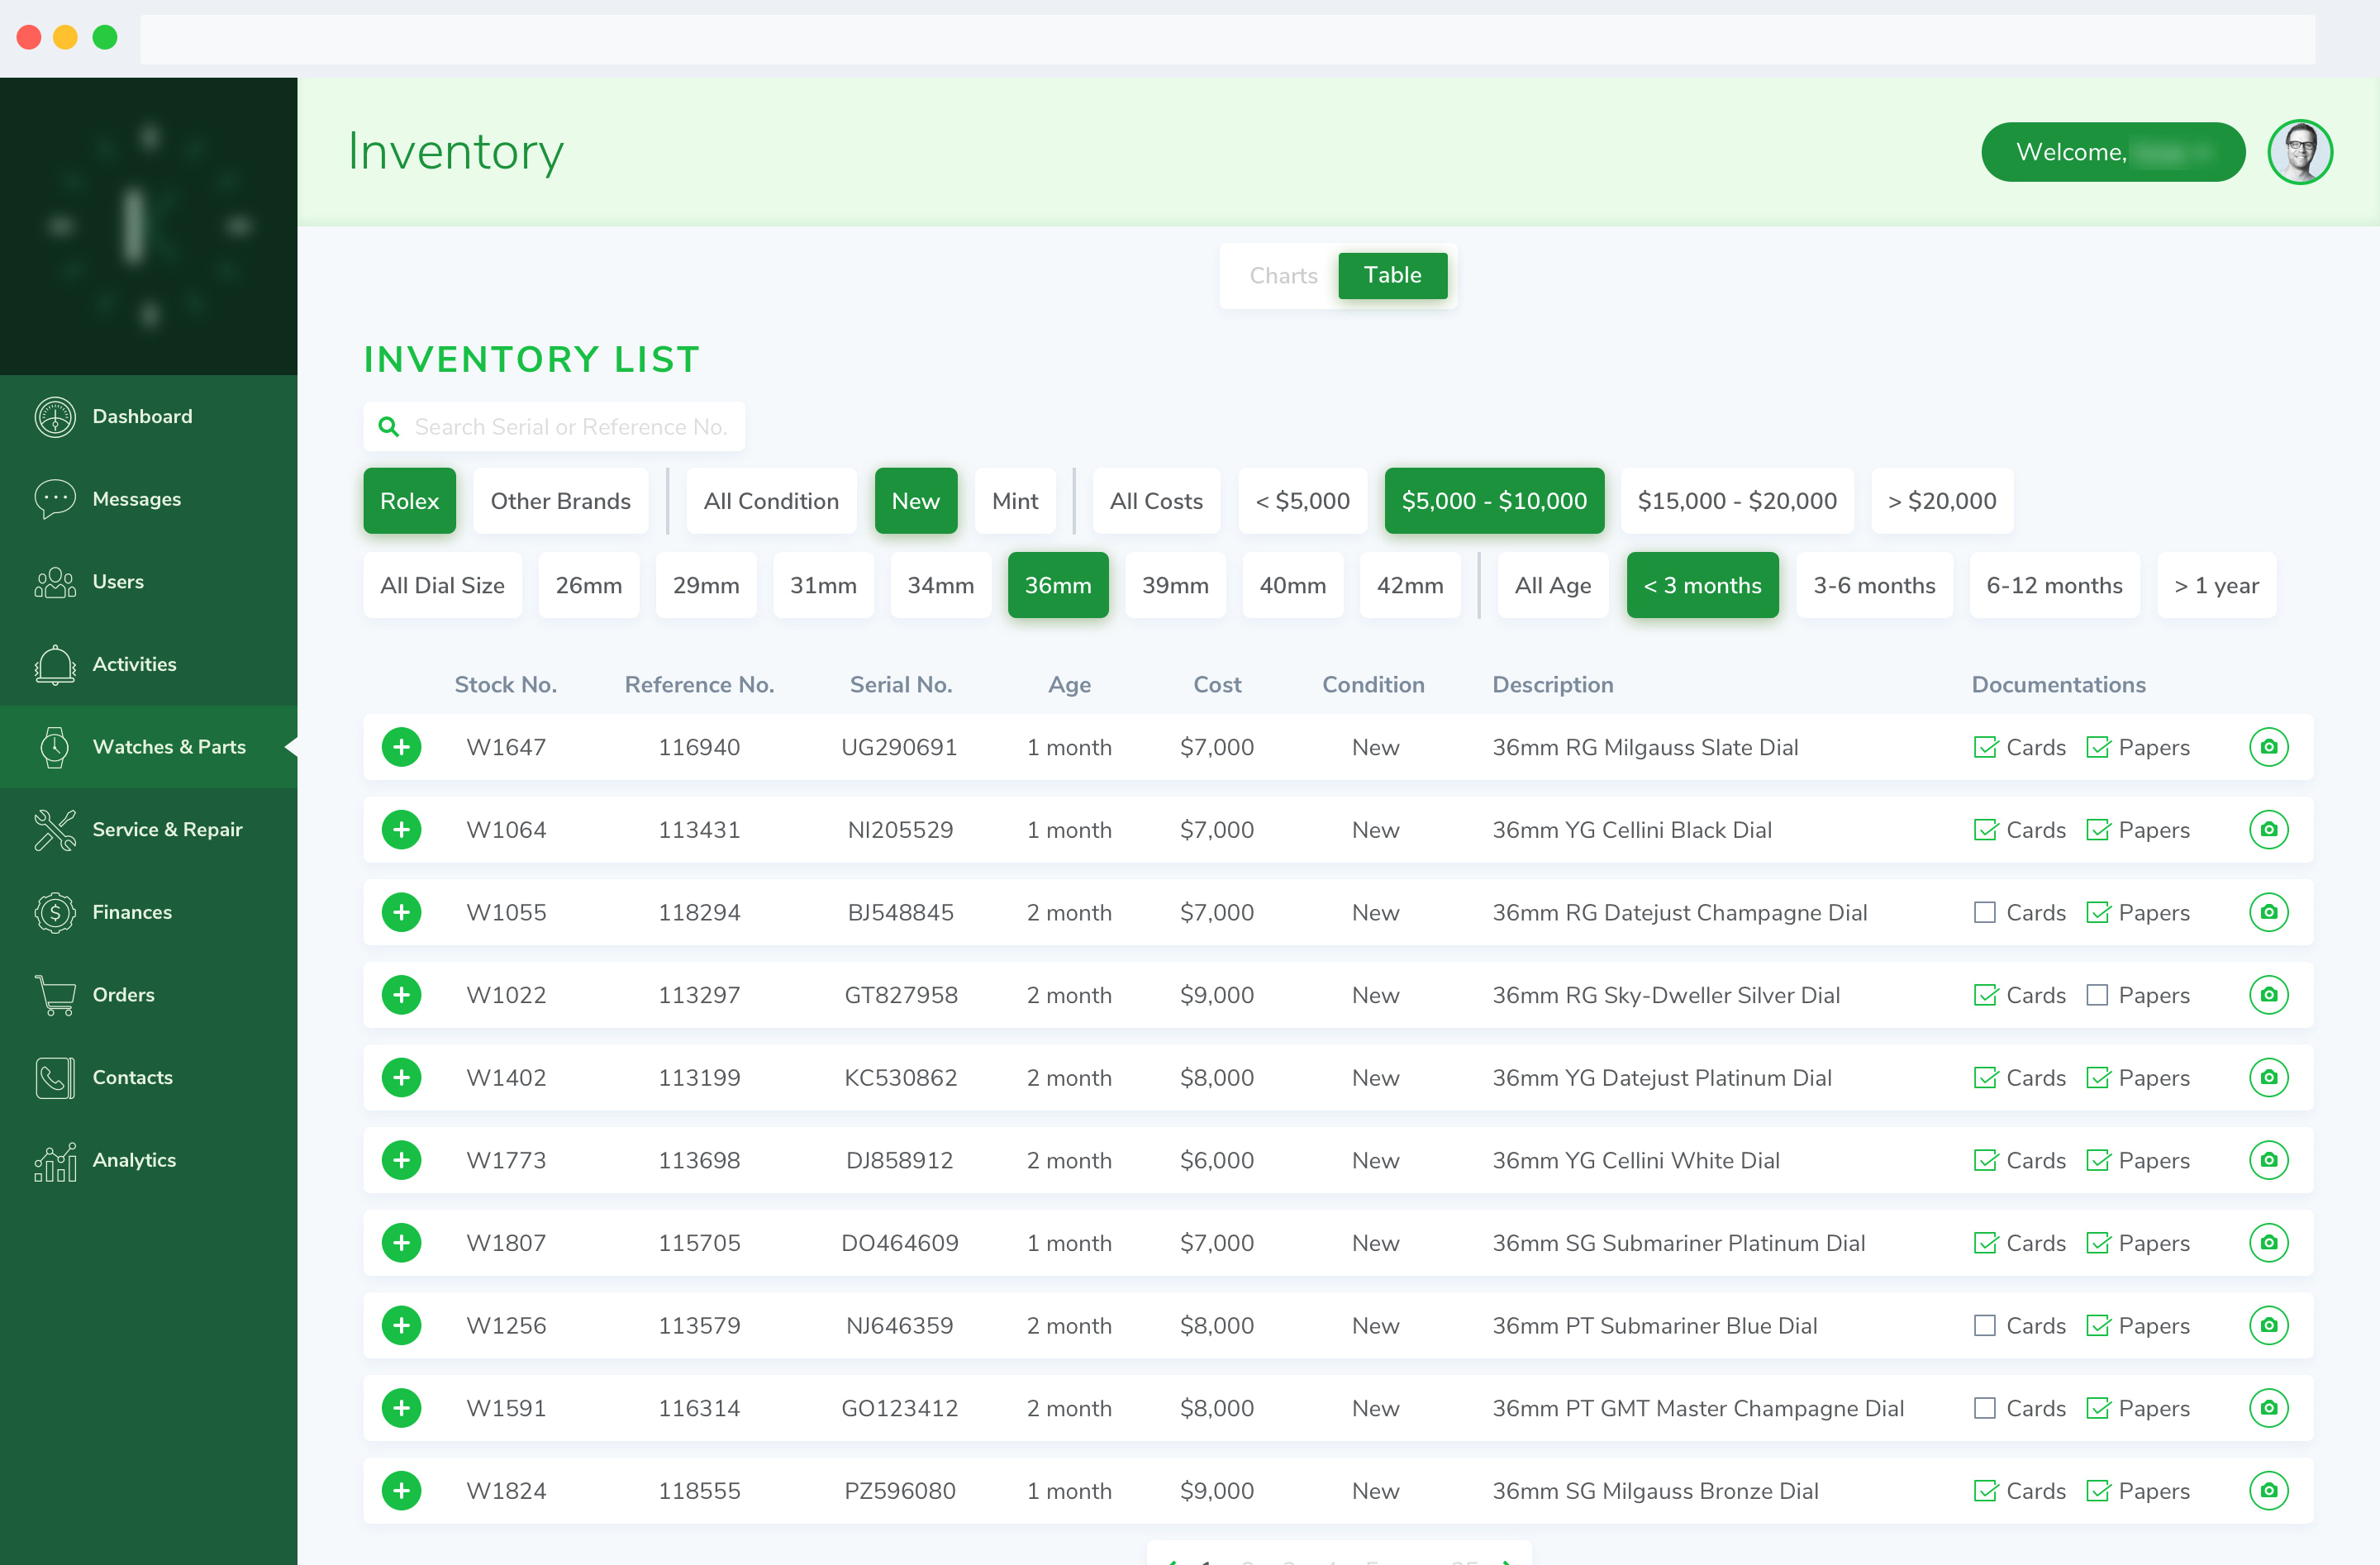
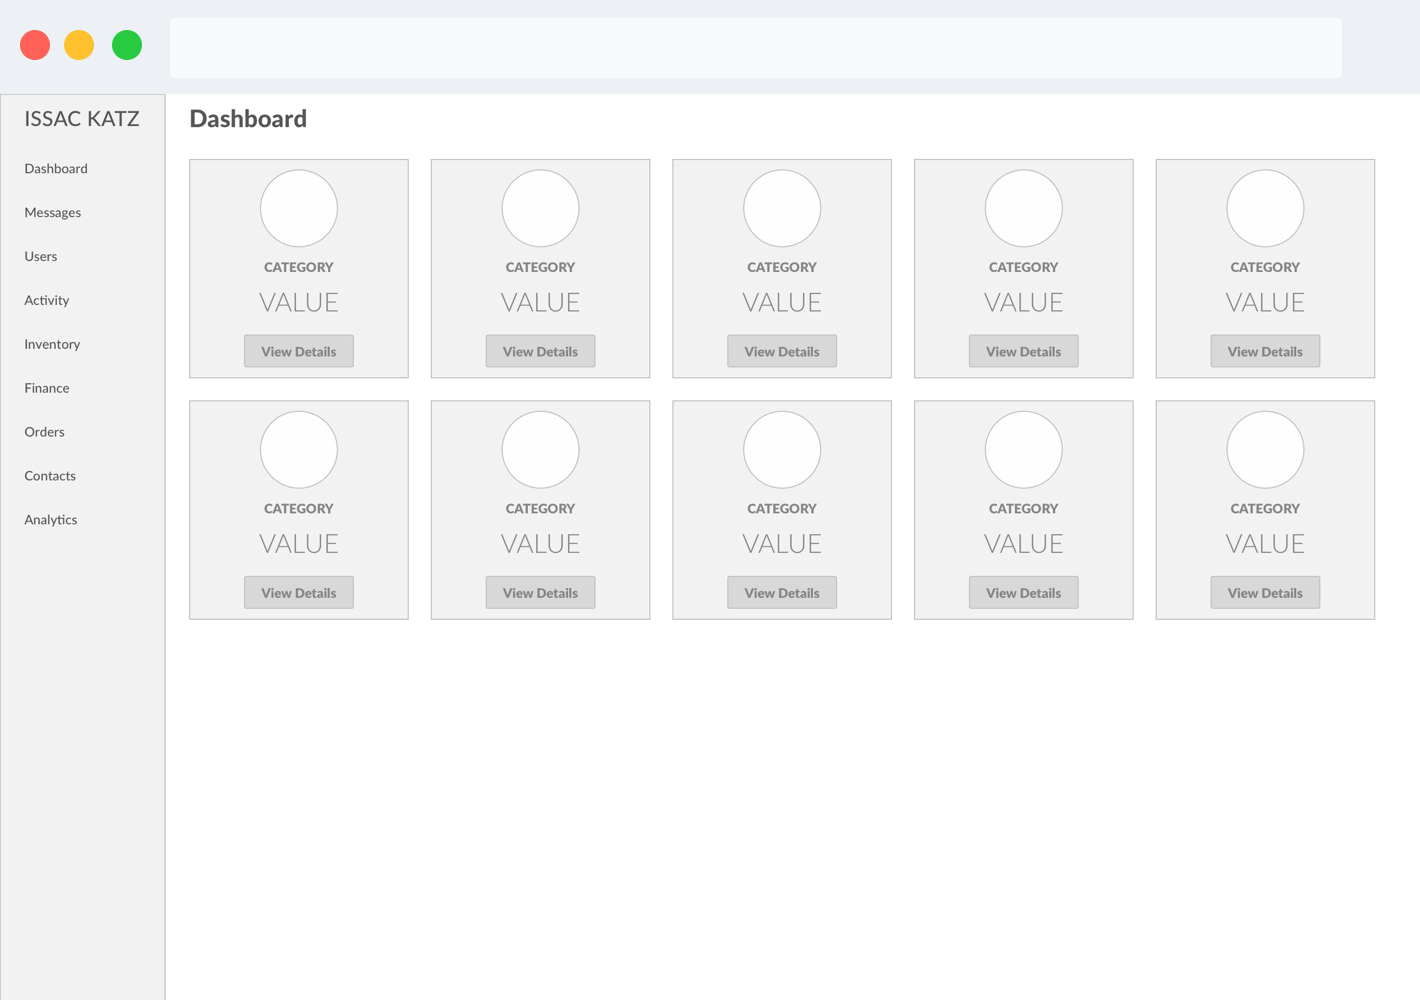
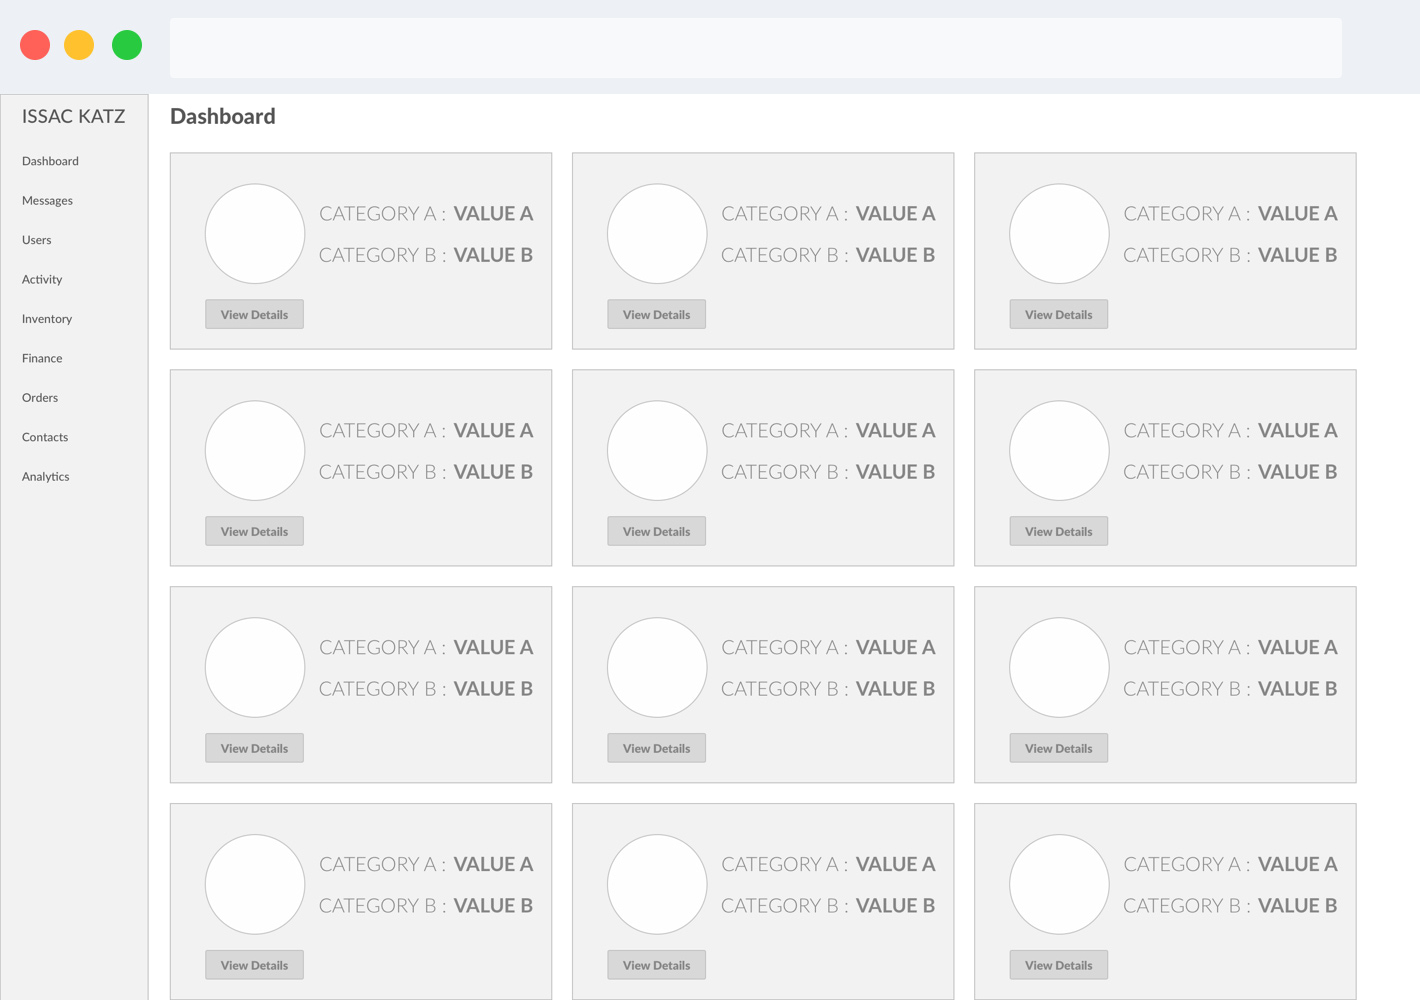
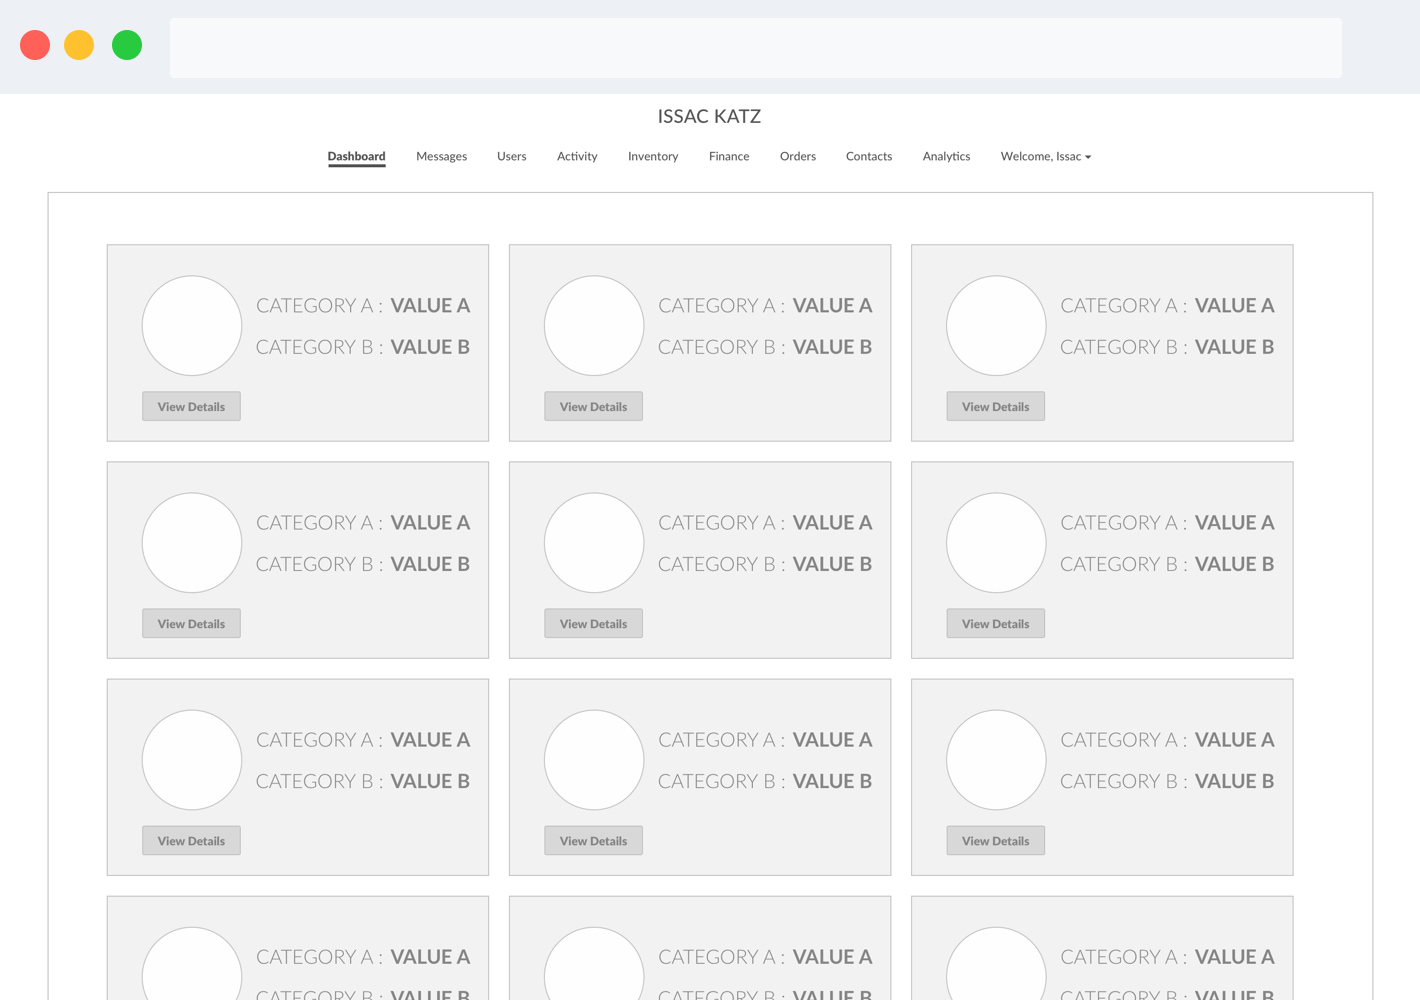
The wireframing process starts on the landing page of the dashboard which should give the user an "at-a-glance" view of the whole company whether it’s the inventory, the sales, the finance, and/or the contacts. The user has to be able to navigate through the data in the tables in an easy-and-straightforward way. This is especially true in the inventory table which is why there are toggles of multiple categories that the user can just interact with which will help the user gets as detailed information as needed.


We can help solve your design problem.
Interested in working with us?
Shoot us an email at [email protected].
We can help solve your design problem.
Interested in working with us?
Shoot us an email at [email protected].
See our other works
